These setup instructions include information on creating and managing a Status Page, including global settings, visibility, and subscriber management.
To skip to a specific section of the "Uptime.com Status Page Solution: Basic Setup" video, click the links with the !
- Creating a Status Page
- Managing Status Page Settings
- Design
- Subscription Management
- Components
- Component-Specific Subscriptions
- System Metrics
- Incidents & Maintenance
- Sharing a Status Page
- Allowlist and Blocklist on the Status Page
-
Creating a Status Page
The following sections will walk through Page features and the creation of your first Page (including components, groups, metrics, adding your first incident, and scheduling maintenance).
To create a status page, click Status Pages > All Status Pages > Create Status Page:
For a full overview of all available fields and options when creating a Status Page, see the document Status Page Forms and Fields.
Viewing Your Page
View all the Status Pages in your account by clicking Status Pages > All Status Pages:
This view includes a breakdown of each status page's name, current status, visibility setting, and the amount of subscribers.
Use the Search bar and Filters options to drill down to specific status pages by name, status, or type:
The More Actions menu allows you to quickly apply management options to the Status Page. From the More Actions menu, you have the following options:
- Manage Page
- Add Incident
- Schedule Maintenance
- Manage Subscribers
- Duplicate
- Delete
Duplicate Status Page
Duplicating a Status Page carries over most settings to the duplicated Status Page:
- All settings under the General tab, with the exception of the Status Page Name (it will be necessary to give the duplicated Status Page a unique name)
- All components and component groups
- All system metrics
- All settings for visual styling under the Design tab
Once a Page is created, click the Preview button next to the Status Page name to see the page as it is currently configured. Note that if your public Status Page has a CNAME record set up, the Preview button will display both the basic public URL as well as the CNAME URL. You can also click Preview at the top right-hand side of the Manage Page view.
Managing Status Page Settings
Use these settings to configure your status page, including settings for who can view your status page, what they can see and click, the detail level of reporting on your Page, and many other options.
Please use the included links to learn more about the forms available for each setting.
General Tab
The General tab determines basic configuration options. For an explanation of each field, see the appropriate section of the Status Page Forms and Fields document here.
Your Status Page is required to have a name, but the description is optional. The text placed inside these fields will appear in the default header of your Status Page. If you use inline HTML and CSS, it is possible to replace or override this text.
Timezone
You are able to set the timezone for the Status Page to control the information that is presented on the external status page from the timezone set. You can also set the time format to be 12H or 24H. This setting will be reflected when viewing any created Status Page events.
Sharing a Status Page
You can share your Status Page through a variety of methods. Setting the page to the Public visibility level and sharing the URL with your viewers is the most direct method. You can also enable subscriptions so that subscribers will automatically receive notification updates from your page, and search indexing can be enabled so that the page can be indexed and discoverable through search engines. Configure these options under the Privacy tab.
Users can:
- Make a publicly accessible Page that is or is not search engine indexable
- Create a custom URL Slug and/or Custom CNAME
- Use Basic Auth to restrict access to users by username and password
Basic Auth
To keep your Page visible only to a select group, utilize the Basic Authentication feature and set a username and password to be used for access to your Page. Set all accessibility parameters by going to the General Tab > Advanced Settings > Password Protection.
Single Sign-On (SSO) and External Users
For accounts with SSO enabled, Status Pages can be secured via SSO and an external Identity Provider (IdP) or via external user logins with the Uptime.com portal.
For detailed instructions, see our article Securing Your Uptime.com Status Page.
Configuring CAA (Certification Authority Authorization) Records for Status Pages
For information about configuring CAA records in conjunction with Uptime.com Status Pages, please see the dedicated document located here.
Creating a Custom Subdomain for Your Status Page
Any account tier can create a Custom Subdomain for your Status Page, allowing users to access your Status Page using the custom subdomain URL instead of the default address that is generated based on the URL Slug.
To configure the Custom Subdomain:
Navigate to Status Pages > All Status Pages and locate the page in the list, using searching and filtering if necessary. Click the name of the Status Page to enter the Manage view. Alternatively, click ⋯ More Actions > Manage Page.
In the General tab under the Advanced Settings section, locate the CNAME field. Enter the desired custom domain that will point to your Status Page (for example, a subdomain such as status.mysite.com or customerstatuspage.com):
In your DNS configuration, create a CNAME record for the subdomain entered in the CNAME field. Set the CNAME Label/Host to the custom domain or subdomain, and point the CNAME Destination/Target to the following address:
cname.uptime.comIf the CNAME does not appear to be resolving properly to the Status Page, please allow some time as CNAME record changes can take up to 72 hours to propagate. If it still does not appear to be resolving, please send an email to support@uptime.com and we will assist in verifying that the record is setup correctly.
Configuring CAA (Certification Authority Authorization) Records for Status Pages
For information about configuring CAA records in conjunction with Uptime.com Status Pages, please see the dedicated document located here.
Current Status
The Current Status tab on the Status Page tells visitors what is happening in real time. Current Status includes overall system status (e.g. operational) as well as multiple sections such as Active Incidents, Components (and status), and Scheduled Maintenance. You can control visibility of these sections when you manage your Status Page.
History
The History tab on your Status Page sums up past outages and scheduled maintenance windows, allowing visitors to browse these events with date selection.
To configure how uptime is calculated, navigate to the General tab and locate the Uptime Calculation setting. You can choose between two options:
| Incident-based | Status Page will only update with details provided by manually added incidents |
| Check-based | Outages appear automatically, but incidents need to be added manually. |
To allow visitors to view performance graphs and reports of check-based components, enable Allow visitor drill down into individual checks under General > Advanced Settings. You can also set a Drill-down maximum time period (in days) to limit how far back visitors can view performance data.
Incidents can be created and managed using the Uptime.com REST API. For more information about related endpoints, see the API documentation here: https://uptime.com/api/v1/docs/#/statuspages
Design Tab
Use the Design tab to add a logo to your Page, or customize the Inline CSS/HTML placed in your header and footer. Users can also add their Google Property ID here, and set a contact email address where visitors can report a problem not listed on the page.
Please Note: some legacy subscriptions may not include the ability to edit CSS and HTML. For information about your account settings, please email support@uptime.com.
Search & Delete
Under the Subscribers tab, you can search for subscribers by email address using the Search field.You can also delete specific subscribers by clicking the Trash icon.
You also have the option to bulk delete subscribers by checking the box next to each subscriber to be deleted, then clicking the Delete button that appears.
Subscribing with a Custom Webhook
Uptime Custom Webhooks offer the option to send notifications to a URL of your choice when an event occurs, allowing for seamless status tracking.
By implementing Uptime Custom Webhooks, real-time alerts can be sent to systems via HTTP POST in a JSON serialized string. These notifications will help subscribers stay informed of any changes in the check status, such as UP to DOWN or vice versa, and take timely action accordingly..
To review an example of the POST request, please click here.
Components
Components represent the core of your page. You can add up to 1000 components, each with an optional description.
If you wish to add a component to an existing page, click + Component or + Group to add a Component Group.
If you Create or Edit a Component, you can associate it with a check. Type the check name or URL, and select it from the dropdown menu. You can then set the state of this check to change automatically when failure conditions are met.
Component Status
To change a component’s status manually, select the status from the dropdown menu within the Components tab of your page.
To automate a change in status, you must do at least one of the following:
- Link a component to a check (Requires setting a status on check failure)
- Add an incident that affects a component or group linked to a check
- Schedule a maintenance window that affects a component or group linked to a check
A change in status, whether manual or automated, is reflected simultaneously live on your page for a given component.
Components always inherit the most severe status, therefore it is possible to manually override an automated change in status if the manual status is more severe. For more information on how this works, see this section on Component Status.
Component-Specific Subscriptions
Your users have control over the components they receive incident or maintenance update notifications for. Once subscribing to your status page, the user can choose which specific components interest them and select them accordingly.
By default, all components are selected, but users can fully customize the notifications they receive based on their preferences.
Once submitted, users will receive an email confirmation, as shown below. From that email, users can unsubscribe or manage their subscriptions at will.
System Metrics
You may add up to 30 system metrics, and customize their names.
To add a System Metric to your Status Page, navigate to the System Metrics tab and click + New System Metric.
System metrics are visible if you have enabled Display "Current Status" tab on your Status Page (in General > Current Status).
Note: If the System Metrics linked to a Status Page are deleted, the System Metrics field will no longer be displayed on the Status Overview section of the Status Page.
Incidents & Maintenance
Incidents and maintenance windows help inform users of scheduled maintenance windows and downtime events (whether standalone incidents or as a byproduct of maintenance operations).
Add incidents and notify visitors of scheduled maintenance windows by clicking + Add Incident or + Add Scheduled Maintenance under their respective navigation tabs. Follow the links for more information on setting up and managing Incidents and Scheduled Maintenance.
REST API Endpoints
The Uptime.com REST API can also update incidents and maintenance windows on your status page. View the relevant endpoints in our API documentation here.
Subscription Management
Navigate to the Subscribers tab to view and manage the subscribers to a Status Page.
View List Of Subscribers
This page displays a list of subscribers in alphabetical order by email. There is an option to either select each subscriber individually, or bulk select them.
Subscription Settings
Click the Settings button while viewing the Subscribers tab to open the Subscription Settings window:
Use the options here to determine how users can subscribe to your Status Page and how subscription emails will appear.
Subscription Channels
Select the channels through which users can subscribe to your page to receive notifications. These include:
- RSS
- SMS
- Webhook
- Slack
For more information about the functionality of each subscription channel, see Subscribing To Your Status Page.
Enable sending notifications to subscribers: select this option to send notifications to all subscribers to the Status Page even if channel subscriptions are disabled. Uncheck this option if you do not want to send notifications to subscribers.
Email Settings
These options determine the appearance of your notification emails.
Send from email: the email that will appear as the sender in the user’s inbox.
Reply to email: the email address that will receive replies to the notification email.
Contact Email Address: page viewers can use this email to report status page issues. The address entered here will appear in the “Experiencing an issue? Contact us” link under the main status banner.
Note: Customizing the Send from email address will require DNS changes for your domain. Please see the changing your SPF record document for more information on how to accomplish this.
Import/Export
From the Subscribers tab, you can Import your subscribers list in .XLSX or .CSV format and Export the subscribers list in .XLS format.
Select Import to display a pop up window allowing you to view a template and upload your XLSX/CSV file.
Allowlist and Blocklist on the Status Page
We provide the ability for Status Page admins to configure what email domains are permitted to subscribe to your status page.
This can be done either from the UI or from the REST API.
For the UI, simply navigate to your status page settings and under the Subscribers tab, you will see the Email Allow List & Block List button.
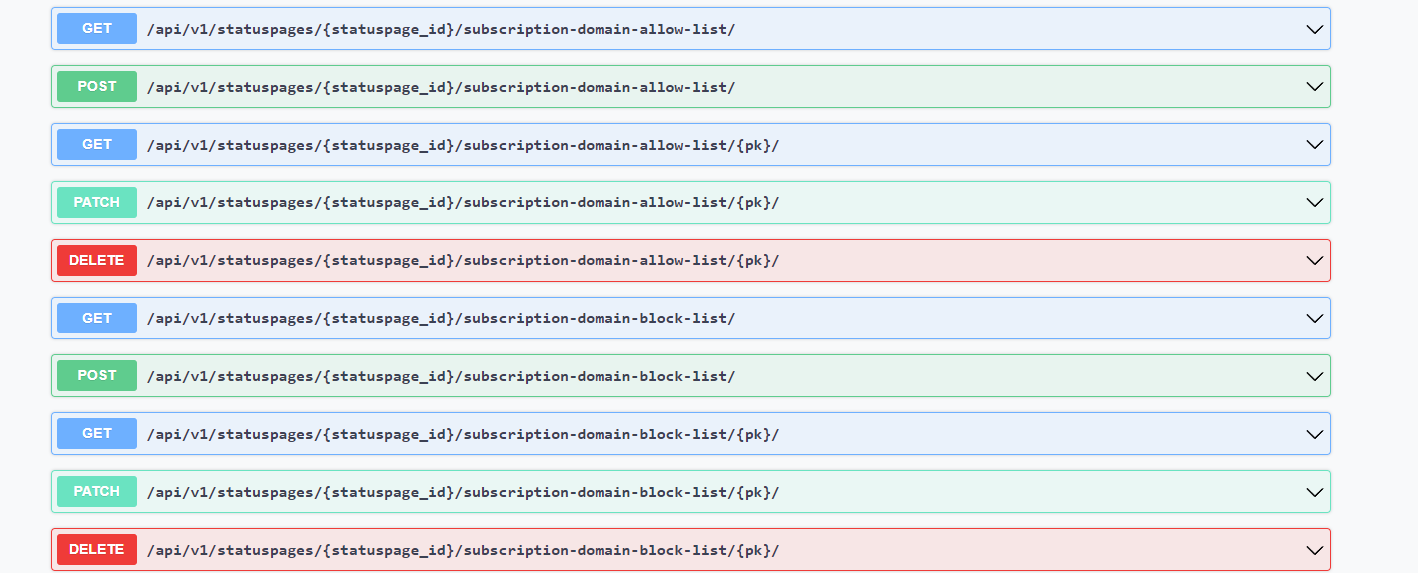
Domain allow list and block lists can also be managed through the REST API. To view these endpoints, navigate to Settings > API > Documentation. Under the status page section, you will see the following endpoints:
-
GET /api/v1/statuspages/{statuspage_id}/subscription-domain-allow-list/
-
POST /api/v1/statuspages/{statuspage_id}/subscription-domain-allow-list/
-
GET /api/v1/statuspages/{statuspage_id}/subscription-domain-allow-list/{pk}/
-
PATCH /api/v1/statuspages/{statuspage_id}/subscription-domain-allow-list/{pk}/
-
DELETE /api/v1/statuspages/{statuspage_id}/subscription-domain-allow-list/{pk}/
-
GET /api/v1/statuspages/{statuspage_id}/subscription-domain-block-list/
-
POST /api/v1/statuspages/{statuspage_id}/subscription-domain-block-list/
-
GET /api/v1/statuspages/{statuspage_id}/subscription-domain-block-list/{pk}/
-
PATCH /api/v1/statuspages/{statuspage_id}/subscription-domain-block-list/{pk}/
- DELETE /api/v1/statuspages/{statuspage_id}/subscription-domain-block-list/{pk}/
FAQ
I received a notification from the Status Page via SMS/email. Which timezone is used for the "Time Posted" field?
The timezone in the notification matches the one chosen for that Status Page, as opposed to the timezone set in the user's account. Here's an example of a notification:

Recently, there was an outage of one of the components, but I can’t see it on Outages. Why is that?
An outage may not be reflected on the Status Page based on the Uptime calculated by setting, specifically when Incident Based is selected. When this option is active, the outages will only appear if you manually add incidents in the Status Page.
When Check-based Component Uptime is selected, outages based on check downtime will appear automatically, though you'll still need to manually update the Status Page when incidents occur.
| Incident-based | Status Page will only update with details provided by manually added incidents |
| Check-based | Outages appear automatically, but incidents need to be added manually. |
There were incidents in one of the components but I see 100% Uptime, which appears incorrect. Why does this happen?
The bars are related to Global Uptime. If there are incidents, and it still shows 100% Uptime, it may suggest that the check doesn’t have the option Include in Metrics enabled under the Execution & SLA tab.
Want to see our checks in action? Check out our YouTube Library for more!
Comments
0 comments